Dynamics

|
Generational Dynamics |
| Forecasting America's Destiny ... and the World's | |
| HOME WEB LOG COUNTRY WIKI COMMENT FORUM DOWNLOADS ABOUT | |
Since 2002 I've been reporting that Generational Dynamics predicts a stock market crash, probably to the Dow 3000-4000 range, probably by the 2006-2007 time frame.
A stock market panic is of course a chaotic event (in the sense of Chaos Theory), and so cannot be predicted. All that can be done is to provide the probability of a stock market crash within a given range of time.
Earlier this month, there was a simultaneous, synchronized meltdown of stock markets around the world -- North America, Europe and Asia -- with all of them falling 5-10%. Although analysts have described this as "the usual ups and downs of the stock market," this was no every day occurrence, and led me to post a weblog article estimating that the probability of a stock market panic leading to a crash was above 50% for the next few months.
The purpose of this article is to "fine tune" the probabilities so that it might be possible to estimate the probability of a stock market crash within the next few weeks with greater accuracy.
The result of this inquiry is that there is a non-negligible probability (say, 10-20%) of a stock market crash beginning with a panic by the end of June, and possibly as early as next week. At any rate, one way or another, the stock market is in the middle of a period of very stormy weather, and it's impossible to be certain whether or not a crash will occur.
In the 2-3 weeks ending Friday, May 19, markets around the world fell significantly, as I described in the weblog article. The following tableau shows the status of several markets, as of May 19:
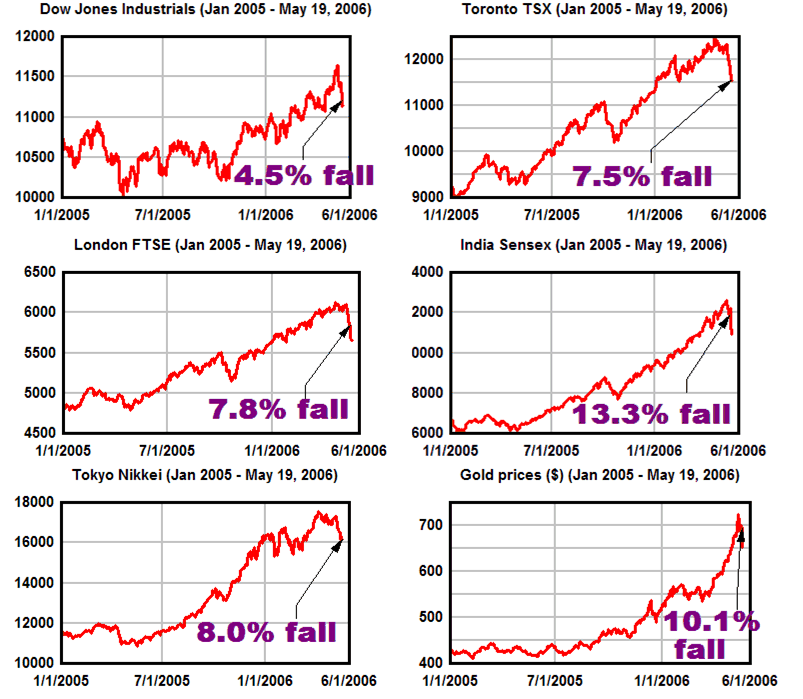 |
The above graphs are representative. Generally speaking, almost all stock and commodity markets around the world fell in the same way, with few exceptions.
Stocks, credit and risk continue their bubblicious rise:
The stock market has reached a fresh record high almost every day...
(19-Nov-06)
As stock market bubble skyrockets, risk premiums are collapsing:
Desperate investors appear willing to take any risk these days to get returns....
(10-Nov-06)
Alan Greenspan blames the housing bubble on the fall of the Berlin Wall:
Meanwhile, the stock market keeps skyrocketing and appears unstoppable to many investors....
(25-Oct-06)
System Dynamics and the Failure of Macroeconomics Theory :
Mainstream macroeconomic theory, invented by Maynard Keynes in the 1930s, has failed to predict or explain anything that's happened since the bubble started, including the bubble itself. We need a new "Dynamic Macroeconomics" theory.
(25-Oct-2006)
Housing market is collapsing faster than economists expected:
Both existing home and new home are falling much more sharply...
(25-Aug-06)
Speculations about a stock market panic and crash :
Will there be a stock market panic next week, next month, or next year, and will it lead to a crash? We speculate on some possibilities.
(31-May-2006)
New Fed Chairman Ben Bernanke gives predictable upbeat testimony to Congress:
Pundits are smiling today, happy that they can understand "plain-speaking" Bernanke....
(17-Feb-06)
Wall Street Journal's page one article on Bernanke contains the usual errors and omissions:
Let me try and explain this a different way....
(8-Dec-05)
Alan Greenspan gives another harsh doom and gloom speech:
Saying that "the consequences for the U.S. economy of doing nothing could be severe,"...
(4-Dec-05)
Ben S. Bernanke: The man without agony :
Bernanke and Greenspan are as different as night and day, despite what the pundits say.
(29-Oct-2005)
The 11% Solution: An article in Barron's says the stock market is very overvalued : New research by analyst Adam Barth finds that average earnings over any 20-year period are surprisingly constant. (11-Jul-2005) Alan Greenspan predicts major losses by hedge funds:
But still says he doesn't have a clue why 10-year Treasury bond interest rates are falling....
(8-Jun-05)
Fed Governor Ben Bernanke blames America's sky-high public debt on other nations:
I'm normally wary of applying specific generational archetypes to individuals, but Bernanke is acting like a Baby Boomer....
(14-Mar-05)
Alan Greenspan warns that global economic dangers are without historical precedent :
In a speech on Friday, Greenspan buried a major change of position in a speech admitting that his assumptions about the economy for the last decade were wrong.
(6-Feb-2005)
Real estate is in an overpriced bubble all over the world:
A study by investment bankers Morgan Stanley warns that the bubble will burst with devastating results....
(30-Jul-04)
| ||
As we'll see, this follows a pattern set by other panics.
A major key to understanding long-range market trends is to look at investor "risk aversion" -- how afraid investors are of taking risks in their investments. The more risk-averse investors become, they more likely they are to stick with "safe" stocks, or the safest investment of all, government bonds.
The opposite of risk-aversion is risk-seeking or, even better, Alan Greenspan's phrase "irrational exuberance." When investors become too risk-seeking, then they make increasingly speculative investments, including stocks that "might" do well in the future. This is what causes a stock market bubble, like the bubble of the 1920s or the bubble of the late 1990s.
In one of Alan Greenspan's last speeches as Fed Chairman, Greenspan discussed the danger of risk aversion, when he said: "Any onset of increased investor caution elevates risk premiums and, as a consequence, lowers asset values and promotes the liquidation of the debt that supported higher asset prices. This is the reason that history has not dealt kindly with the aftermath of protracted periods of low risk premiums."
This is exactly what was happening last August, when Greenspan gave the speech, and what is clearly happening right now. We're in a period of increasing risk-averseness in investors. Investors are becoming increasingly cautious, and they're selling stocks and using the money to liquidate their debt, with the result that stock prices are falling. As we're about to see, this is a process that began seriously in early 2004, and is becoming increasingly powerful as time goes on.
This is important: There is absolutely NO CHANCE at all that this trend toward increasing risk-averseness is going to be reversed any time soon. The "irrational exuberance" we've seen went on for over a decade, and it will take at least as long for the risk-averseness to subside.
This fact alone means that it will be years before we can possibly return to the happy days of continually increasing stock prices.
How do we measure the level of investor risk-averseness?
Actually, there's a very simple way to do it.
At the bottom of the home page of this web site, there's a graph that changes weekly showing the S&P 500 price/earnings index for the last ten years. Here's the chart as of May 26:
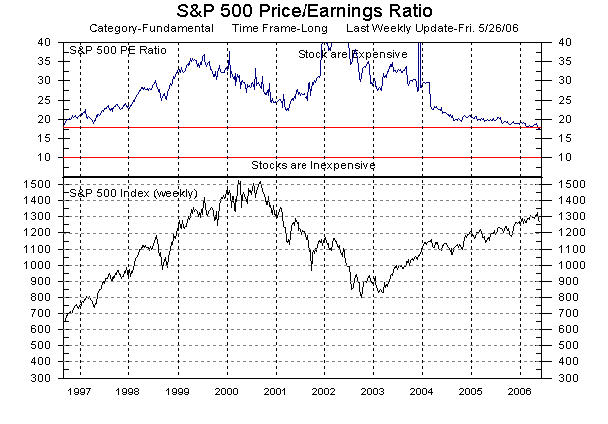 |
The bottom of this chart depicts the S&P 500 stock index, but for now we're only really interested in the top part.
This graph shows the value of the "price/earnings index" for the same 500 stocks; that is, the average value of the price of a share of stock divided by the company's earnings per share for the last year.
Here's a simpler explanation: If you pay $100 for a share of stock, how do you know if you're getting your money's worth? One way is to look at how much the company is earning. If the company is earning $5 per year for each outstanding share of stock, then the P/E ratio $100/$5, or 20.
You can also think of the P/E ratio as being VERY ROUGHLY equal to the reciprocal of the interest rate you'd be earning. If the P/E ratio is 20, then the corresponding interest rate would be 1/20, or 5%.
Now we're going to turn things around. The above chart of P/E ratios tells you something about stocks and their prices, but if you look at it the other way, it tells you something else: It tells you how risk-averse investors are.
As you can see from the chart, P/E ratios were very high through the 1990s until the beginning of 2004. This means that investors were HIGHLY RISK-SEEKING through that period. There were very extravagant in the amount of money they were willing to spend for stocks.
Then, early in 2004 something happened to cause investors to sober up. Perhaps it was because it was the beginning of the Presidential election campaign, or perhaps it was because job creation was far below what experts had been predicting.
Whatever it was, investors -- as a group -- got scared at the beginning of 2004. Suddenly they were demanding higher earnings for a given stock price. They weren't as willing to take as many risks as they'd been taking for the previous decade.
As you can see from the above graphic, investor risk-aversion fell sharply in 2004, and continued falling for eight months before it leveled off around a P/E ratio of 20.
Then it remained steady for a year.
I noticed this phenomenon in August of last year, and wrote an article asking the question: "A new mystery: Why is the P/E ratio remaining constant?"
My conclusion at that time was that investors were all following the same formula (probably the so-called "Fed Model" that the investor herd is following), with the result that investors, as a group, are following the same level of risk-averseness.
Since August, investor risk-averseness fell even further, and dropped a lot more in the last couple of weeks.
This brings us to the question of stock market volatility. Volatility refers to a period when the stock market makes large jumps up and down -- exactly what's been happening around the world since the beginning of May.
Once again, it means that all investors are making similar decisions, and acting like a herd.
When an investor makes a buy/sell decision, there are two things to be considered:
In normal times, investors decide whether to buy or sell individual stocks almost entirely on the first criterion, and the stock market as a whole is not affected. One investor buys stock A and another investor sells stock B, and from the point of view of the entire stock market, it all evens out.
But when investors all sell stocks A, B, C and D because they're afraid that the entire market is going to fall, then something very different is happening. The value of an individual company becomes unimportant.
This is what causes stock market volatility.
In normal times, an individual stock might be extremely volatile; it goes up if the company announces a new product, and it goes down if there's a corporate scandal. This is not unusal for an individual stock. It might go up or down by 10%, 20% or more in a single day, depending on the news.
But when investors act in unison, buying or selling stock A, B, C and D at the same time because of market considerations having nothing to do with the individual stocks, then the entire stock market is essentially a single stock, and becomes as volatile as a single stock.
But what happened early in May is even more remarkable. Take another look at the tableau of six markets around the world at the top of this article. All six of these markets, as well as other markets not shown, fell in unison.
This means that we've gone beyond the point where investors in a single market are acting in unison; what's happening now is that investors in all markets are acting in unison.
This is a brand new thing. Investors have gone from investing in individual stocks to investing in individual markets, and now, to investing in all the world's stock and commodity markets as a whole, as if the world were a single market. Uniformly, there's a flight to cash or to government bonds.
Incidentally, a weak version of this situation did occur last year -- in October. As I wrote at the time, markets around the world were extremely nervous because previous panics (1929 and 1987) had occurred in October. I wrote that I didn't expect a panic because -- perversely -- a lot of people were worried about and prepared for a panic. If you examine the data, you see that the India, TSX, FTSE and Nikkei markets all took a fall, roughly between 10/3-10/21. However, the Dow wasn't fully synchronized -- it fell from 9/30-10/13, and began a volatile rise -- and commodity markets were completely unsynchronized.
It's not surprising that there have been "almost" episodes of the current situation, since the markets have been increasingly nervous for the last two years, especially since early 2004 when investors have become increasingly risk-averse. In fact, I wrote an article last year in April, a little over a year ago, pointing out a recent episode of volatility. However, that episode applied only to the New York markets, not to other markets.
However, nothing in recent times matches the current situation. Investors are not moving money from market to market; instead, they're taking money out of ALL stock and commodity markets simultaneously, and moving it to cash or government bonds.
Nothing like that has happened recently. It's the synchronization of ALL markets that makes this situation so particularly dangerous.
Generational Dynamics predictions fall into the category of what I call "long-term forecasts" or "trend forecasts." This means that it can predict that something will happen with 100% certainty -- a war, a stock market crash, etc. -- within a period of years or even decades. Such predictions are not very useful because the dates are so indefinite.
The kinds of predictions that you hear from journalists, pundits and high-priced analysts are what I call "short-term forecasts," or "political forecasts" or "chaotic event forecasts." These forecasts would be VERY useful if only they could be counted on. For example, an analyst might predict that the stock market will go up tomorrow, but that prediction has only a 50% chance of coming true. I always like to say that it's easy to get a million predictions right -- just make two million predictions!
The work that I've been doing since 2003 is with the following objective: To combine long-term and short-term programming techniques so that the combined predictions cover much shorter periods of time and have probabilities well above 50%.
This work has turned out to be spectacularly successful in making a series of predictions, none of which have been wrong. Some have come true, and some are still pending, but none have been proven wrong.
Some of these predictions are as follows:
These are not the kinds of predictions that you read in newspapers or see on television. They're not particularly sexy and they don't have broad public appeal. Many people are turned off by them. Nonetheless, they do have one huge advantage over typical newspaper and television predictions: They're true.
A recent best-selling book by Philip Tetlock, Expert Political Judgment: How Good Is It? How Can We Know?, says that, based on many years of research, that ALL political pundits are wrong, and that, in his research, even the greatest experts' are no more accurate than pure chance. However, Tetlock apparently isn't aware of my web site, because I've made dozens of predictions in the last 3 1/2 years, and every single one of those predictions has come true or is coming true. Not a single one has been proven wrong.
There is no other web site on the Internet like this one, and no other one with anything even close to its success rate in making predictions.
Of the predictions listed above, it's the last one that this article is about.
First off, even this prediction contains both long-range and short-range elements. The long-range prediction of a major financial crisis / stock market crash during the next two or three decades is true with near 100% probability; but narrowing it down to "probably by the 2006-2007 time-frame" was a short-range, probabilistic prediction. I didn't give a probability for that time range but, based on an examination of previous trends over the last 100+ years, I felt the probability was around 80%.
So now, as the probable date of the financial crisis approaches, it's time to try to narrow down the date of the coming panic.
We now have a long-range trend prediction that a stock market crash is coming. The way to narrow down the time is to compare the current world situation to similar times in the past, to see what happened.
But you might say, "That's what journalists, politicians and analysts do all the time. They say that today's market is 'similar' to the market in 1985 or 1975 or whatever, and they use that information to predict what's going to happen."
This is the big difference between ordinary methodologies and the Generational Dynamics methodolody.
What Generational Dynamics has done is to develop a series of "chaotic cyclic trend attractors" -- in the sense of Chaos Theory -- that go through history.
This work was begun by Strauss and Howe in the 1980s, and published in their best-selling books Generations and The Fourth Turning. They showed that England and America followed certain cyclic generational patterns from the 15th century to the present.
Work on Generational Dynamics has extended their work to all countries at all times in history. These patterns identify the worst kinds of wars -- "generational wars" or "crisis wars" -- and identify the world kinds of financial crises.
So when you do historical comparisons, you cannot simply make those comparisons to any previous time in history; you have to use comparisons that occur at the same point in the generational cycle.
For example, comparing today's stock market to the 1990s or the 1960s is meaningless, because those are at different places in the generational timeline; you MUST go back to the period just prior to the Great Depression.
This technique is used heavily on this web site to predict what's going to happen in Darfur or the Mideast or other world locations. This fact explains why this web site has been 100% successful in making predictions, while other web sites are no more than 50% successful.
Generational Dynamics has identified the following generational financial crises since the 1600s:
 |
Tulip prices kept going up, and investors from all over Europe soon began purchasing a kind of "Tulip future," a certificate purchased in the fall which can be traded for a specific actual tulip to be grown the following spring. In 1636, speculation in tulip futures went through the roof. On February 3, 1637, the tulip market crashed, causing people all over Europe to lose all their money. At this point, the Thirty Years War enveloped all of Europe.
How could this have happened? Actually, it's quite easy, and it's how all bubbles (and pyramid schemes) work. Suppose I pay $100 for a certificate guaranteeing me a certain tulip six months from now. I sell you the certificate to you for $200, and I've made $100. You sell the certificate back to me for $300, and you've made $100. I sell the certificate to someone else for $400, and I've made another $100. So now the certificate is worth $400, but the underlying tulip is exactly as it was when the certificate was worth only $100.
Exactly the same sort of thing has happened in today's stock market. The underlying value of the stock market today is around Dow 4500-5000, so the market is over 200% overpriced. Hedge funds and derivatives are even more overpriced, so the bankrupticies will begin there after a panic.
It's amazing to me how few people understand this simple concept. If you bought a dozen oranges today for $3.00, and a few days later the cost of a dozen oranges had risen to $4.00, then people would get angry and ask what corporation is gouging the consumer. But if a share of stock goes from $3.00 to $4.00, everyone seems to think that's only good news, and no one ever asks the obvious question: Why is that share of stock worth more today than it was worth last week?
Here you can see the generational aspects of these huge financial crises. The South Sea Bubble would have been completely impossible a decade earlier, because the senior people making investment decisions had lived through the Tulipomania bubble, and would have recognized the frenetic craziness surrounding trading in the South Sea company. But by 1717, when the bubble really took of, exactly 80 years had passed since the bursting of the Tulipomania bubble, and all the people who personally remembered it were gone (dead or retired).
Once again, you see the generational aspects. The French Monarchy ran up debts in the 1780s at just the time that the generation of people that had grown up during England's similar profligacy had all disappeared. Today, of course, it's the United States that has similarly run up huge debts that are still growing exponentially.
A sidelight to the bankruptcy of the French Monarchy is provided by Charles Dickens' 1843 novel, A Christmas Carol, which describes a generational struggle between an old skinflint, Ebenezer Scrooge, and his struggling employee, Bob Cratchit, who has a crippled son, Tiny Tim. Actually, Scrooge's miserliness was quite justified, according to what the novel tells us about his past. The bankruptcy of the French Monarchy had impoverished all of Europe, and many people starved to death or went to debtors' prison. In fact, Ebenezer Scrooge's own father had died in poverty, and Scrooge had been separated from his sister because of poverty. So Scrooge's whole life was shaped by the horrors of his experiences with the bankruptcy.
As an aside, a year later, Congress passed the Smoot-Hawley Act of 1930. It was a tariff act, designed to protect American jobs during the Depression, but it was regarded as a full-fledged act of war by the Japanese, because it shut down Japan's biggest cash crop, silk, which they could no longer export to America. After that, one thing led to another: Japan invaded Manchuria, America and the League of Nations imposed an oil embargo on Japan, further crippling their economy, Japan walked out of the League in 1933, which was clearly done in anticipation of war. If you ask almost any American what caused WW II, he'll almost certainly say Hitler. (At that point, I always like to ask why Hitler decided to bomb Pearl Harbor.) But in fact WW II began in the Pacific before it began in Europe, and it can be reasonably argued that the first blow in WW II was the Smoot-Hawley act of 1930.
Why did the Internet bubble begin in 1995? Why not 1990 or 2000? You can search everywhere and you won't find a plausible explanation for that. There's only one plausible explanation: the bubble began at exactly the time that the senior financial managers who had personal memories of the Crash of 1929 all disappeared (retired or died), all at once, all at around the same time.
This is one of the simplest and most obvious findings of Generational Dynamics, and yet I've discovered that journalists, politicians and analysts never consider any generational explanations at all, even the simplest and most obvious.
The 1990s bubble has not yet fully unraveled. You can see that from the price/earnings graphic above. When it does, the stock market will fall to the Dow 3000-4000 level, and there will be massive bankruptcies, starvation and homelessness, just as there was in the 1930s.
These are the major worldwide bubbles and crashes since the 1600s. I suspect that another one can be identified around the 1850s or 1860s, related to Spain's frantic spending at that time.
Research has gone on for a century or more, trying to identify stock market cycles.
The most well-known attempt is the Kondratiev cycles, which are technology-based cycles roughly 40-50 years long. They were identified in the 1920s by Russian research Nikolai Kondratiev. It was a great theory until its predictions were contradicted by the Great Depression and WW II.
Probably thousands of researchers have attempted to repair the Kondratiev cycles theory since then but as far as I can tell, no one has identified the obvious explanation: Generational cycles are COMPLETELY INDEPENDENT of technology cycles. They're completely different data series. So if you want to see Kondratiev cycles work, then you have to subtract out the six generational crises that I identified in the last section.
To see how stock cycles work, examine the following fairly busy graph:
 |
The above graph contains several elements:
This graph shows that the Kondratiev theory is correct, but only provided that the generation cycles are ignored. If the effects of the six generational crises are subtracted, then the stock market index does follow the Kondratiev pattern.
Generational theory is based, in a sense, on George Santayana's famous saying, "Those who cannot remember the past are condemned to repeat it." That is, crises recur when the generation that lived through the last crisis is replaced by a generation that can't remember it.
But why can't the new generation remember the crisis -- at least in the form of stories retold by parents and history teachers? Why is it impossible for a new generation to learn wisdom from an earlier generation?
A relatively recent theoretical development in Generational Dynamics is a new mechanism by which wisdom gets lost. The mechanism is called the "false panic," and it seems to occur 55-60 years after a previous disaster.
The panic of 1987 is an example of a false panic, and it played a pivotal role in permitting the situation we're in today.
When I was growing up in the 1950s, there was enormous fear of financial ruin. The Great Depression was discussed frequently in school and by my parents and their friends. This nervousness carried through the 60s, 70s and 80s. You used to hear investment advice that distinguished "low-risk, low-yield" investments for seniors from higher-risk growth investments for younger people.
By the 1990s, all that had changed. Everyone expected low-risk, high-yield investments. That's still true today (although investors are now getting "risk-averse" again, as we discussed above).
The event that triggered the change was the False Panic of 1987. It's a "false panic" because the stock market recovered quickly, within a few months.
The Panic of 1987 occurred 58 years after the crash of 1929. Anyone who remembered the 1929 crash had to be 55 years or older.
Thus, the 1987 panic appears to have occurred at the time of a significant generational change. Whatever latent fears that still existed about a recurrence of the 1929 panic were focused on this moment, as those who remembered the 1929 were quickly disappearing, and were replaced by those who didn't personally remember it.
The 1987 panic seems to have an important milestone in the generational changes that led to today's situation. Before 1987, older people frequently expressed fear of another crash and another Great Depression. This fear was an important part of public policy, business policy, and investment policy.
But the quick recovery after the 1987 panic seems to have reversed the public mood. After this, the public seemed to believe that the problem of panics and depressions had been solved.
Since then, no one has any fear of a new stock market crash. Even the current Fed chairman, as I described in my essay, "Ben S. Bernanke: The man without agony." I contrasted Bernanke's "What? Me worry?" attitude with Alan Greenspan's much more sober and somber attitude.
Ironically, it's Alan Greenspan who's credited with saving the country from a stock market crash in 1987 by lending loads of low-interest cash to a number of financial institutions to prevent them from going bankrupt after the panic occurred. His actions were very valuable for many reasons, but they didn't prevent a long-term stock market crash; that wouldn't have happened anyway, since stocks at that time were underpriced or moderately priced.
By contrast, stocks prior to the 1929 crash were over 200% over priced, as they are today, and taking actions today similar to Greenspan's 1987 actions would not prevent a long-term crash, even though Bernanke believes that they would.
From the point of view of Generational Dynamics theory, the false panic of 1987 was an important milestone, because it provided the means by which the investor community lost the "wisdom" that older generations had accumulated by living through the Great Depression of the 1930s.
Within ten years, the internet bubble had begun in earnest. Today, almost no investors even believe there's a danger of a stock market crash, with the result that they're following policies which they'll soon consider to have been absolutely insane.
Incidentally, this concept of a "false panic" is a relatively new addition to Generational Dynamics theory, as we said above, and requires further research for verification.
However, as an aside, we'll give another interesting example:
In 1976, the public became hysterical over a possible "swine flu" pandemic. Responding to public demands, the government prepared millions of doses of swine flu vaccine. The pandemic amounted to nothing, and the whole thing was a political fiasco.
This was a false panic that occurred exactly 58 years after the Spanish Flu epidemic of 1918. It appears to be the same kind of thing as the false panic on Wall Street in 1987. Up to that point, people were afraid of a recurrence of the 1918 epidemic. The 1976 panic was a political fiasco that reversed the public mood, and left the public with no further fear of a flu epidemic. That's why the public today has no fear of a bird flu pandemic.
The number 58 seems to be a kind of magic number in generational theory. If you measure the time from the end of one crisis war to the begining of the next crisis war, as I've done for over 100 crisis wars throughout history and time, you find that these periods are almost always 50-70 years, with the most common period being 58 years.
Apparently 58 years is the most frequent point where one generation passes the baton to the next generation, and it's exactly at that point that the wisdom of the older generations is lost, and has to be relearned by younger generations the hard way. This needs further research, especially to determine whether the same 58 years applies to other countries and other times in history.
A panic is a psychological thing, when investors, well, panic. It can happen because of bad news, like 9/11 or other catastrophe, or it can happen for generational reasons. We've identified two types of generational reasons: A stock market crash because of a generational bubble, and a "false panic" like the one in 1987, that occurred 58 years after the 1929 stock market crash.
Today we know this: We're in a generational bubble, and a crash is overdue. Recently, all the worlds markets fell in a synchronized fashion, as if they were one market. Investors are becoming increasingly risk-averse, and many analysts are predicting further downward moves.
Given these facts, we can readily estimate that the probability of a crash is 50% or over the next few months, but can we narrow it down further?
Let's take a look at the stock market during three previous panics, and then look at todays stock market:
|
In 1929, the stock market peaked on 9/3, then had a smaller peak on 10/10. Black Thursday was 10/24, and 10/29 was the worst day in Wall Street's history. | |||
|
In 1987, the stock market peaked on 8/25, had a smaller peak on 10/21, and then had a panic on 10/16. We've included this graph even though this is a "false panic," because it illustrates the pre-panic pattern. | |||
|
On 12/29/1989, the Nikkei index for the Tokyo stock market peaked, then had a smaller peak on 2/6/1990; a panic occurred on 2/21. | |||
|
As of Friday, the stock market had reached a peak on 5/9, and appeared to be heading for a smaller peak. |
As you can see, the first three graphs show that the stock market reaches a peak, then falls, and then, shortly thereafter, reaches a new, smaller peak, after which there's a panic.
You can speculate about the psychology of all this. The second peak provides a false sense of hope, and when the market starts falling after that, everyone panics and sells, sells, sells.
If you compare the last graph with the three previous ones, and assuming we stay on a similar path, then there should be a panic within the next two weeks.
Or should there? You could probably find hundreds of times in the last century when the stock graph was similar to the top three, and no panic occurred.
So let's put it this way: If you're out on a sailboat on the ocean, then on some days the weather will be sunny and mild, with a light breeze, and sailing will be a delight; on other days, the weather will be so stormy that your very survival is at stake, and there's no way to tell whether the boat will capsize.
Well, for the next few weeks, the stocks markets will be going through very stormy weather, and one can only guess whether they'll capsize.
 |
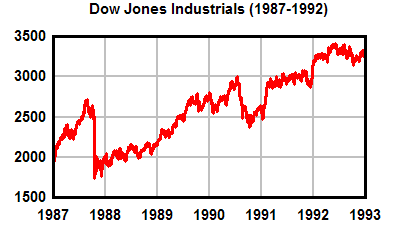 |
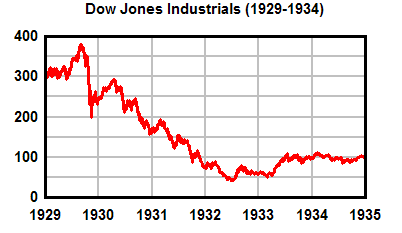
The above graph shows that after the 1929 panic, the stock market kept crashing for four years, but after the 1987 "false panic," the stock market recovered quickly.
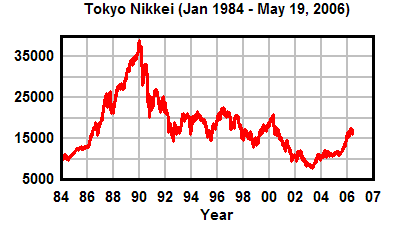 |
The adjoining graph shows that the Tokyo Stock Exchange suffered a major crash in 1990, from which it hasn't yet recovered.
When a new panic occurs, pundits, journalists, politicians and high-priced analysts will all tell you that the fall is temporary, and they'll be comparing it to the 1987 false panic; but they'll be wrong, and the market will continue to fall to the Dow 3000-4000 range.